Can conservation organizations use big data analytics to tackle corruption in the forestry sector?
By
-
Antony Bagott,
-
Ben Brock,
-
Stephanie Pendry,
-
and Willow Outhwaite
Under the TNRC project, TRAFFIC is exploring whether big data techniques can be used to identify corruption occurring in the timber sector, specifically at the point where government agencies allocate companies the rights to harvest resources. The data flow model outlined in this blog post offers a ‘preview’ of further insights that will be shared in a TNRC Learning Series Webinar in 2022.
INTERPOL estimates that the annual global cost of corruption in the forestry sector is approximately USD 29 billion, and those most likely to be involved are government officials from forestry agencies. Harvesting often takes place on public lands in remote locations. When combined with weak governance, limited transparency and complex supply chains, the allocation of timber harvest rights is a point where significant corruption can take place, but it is hard to detect (Outhwaite, 2020).
The occurrence of corruption is often detected by civil society through painstaking analyses of data. For example, Earthsight spent two years investigating illegal logging and timber corruption in Ukraine, and tracking connections to overseas markets. Similarly, EIA gathered a huge amount of information to identify timber concessions linked to illegal activities in Peru. For certain tasks, the use of big data analytics can be much faster than having a human manually attempt to find relationships, and it may even detect patterns and anomalies that a human would miss.
The use of big data analytics offers a way to uncover hidden patterns of relationships that are often signals of nepotism, cronyism, influence peddling, bribery and other corrupt acts in the allocation of harvest rights. Investigative journalists and data analytic start-ups have used similar techniques on the Panama Papers – a database of 11.5 million leaked documents – to reveal the opaque dealings of offshore companies, trusts and foundations that use tax havens to hide the wealth of the global elite. By combing through available datasets of administrative information and applying the appropriate analytical tools, meaningful relationships can be found between different pieces of data on a large scale.
The use of big data analytics offers a way to uncover hidden patterns of relationships that are often signals of nepotism, cronyism, influence peddling, bribery and other corrupt acts in the allocation of harvest rights.
With this in mind, through the TNRC project, TRAFFIC is exploring whether big data techniques can be used to identify corruption occurring in the timber sector, specifically at the point where government agencies allocate companies the rights to harvest resources. Following extensive research and consultation with experts and stakeholders, TRAFFIC has created a data flow model to define the processes that should be followed to achieve this.
Detecting the threat
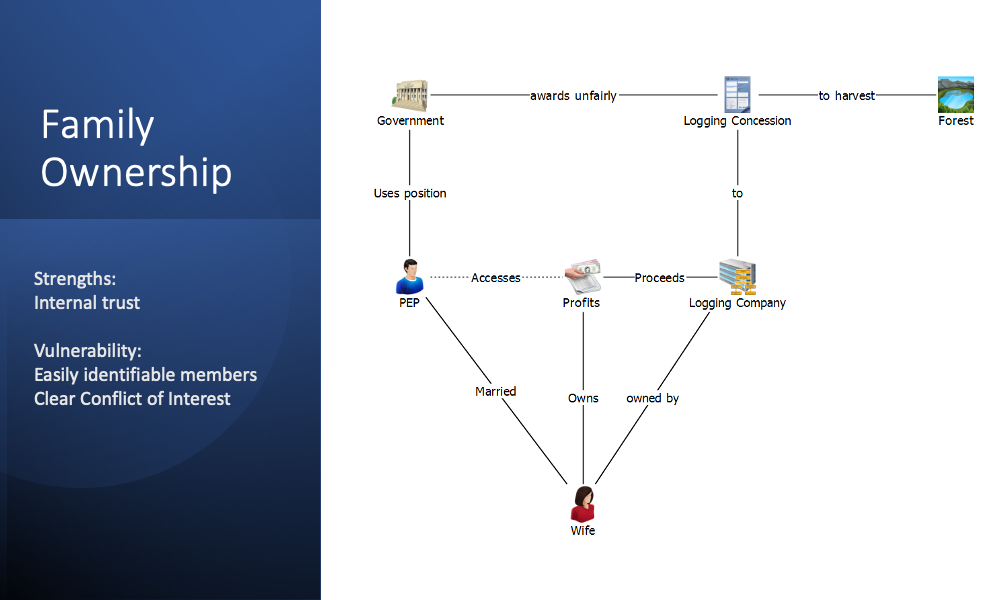
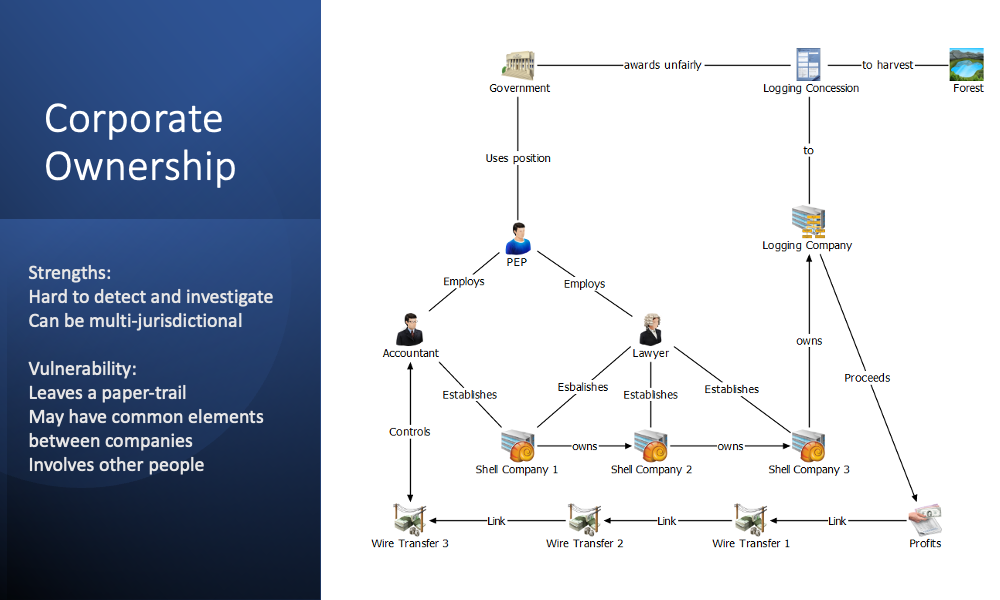
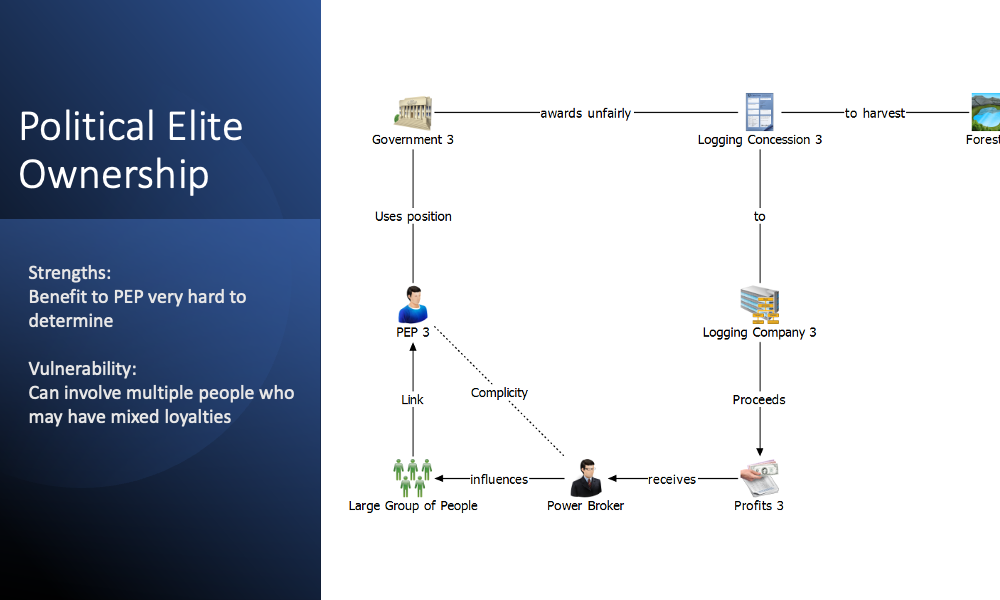
We developed a number of ownership models to understand the strengths and vulnerabilities of models based on family, corporate and political elite relationships. The diagrams below illustrate these approaches.
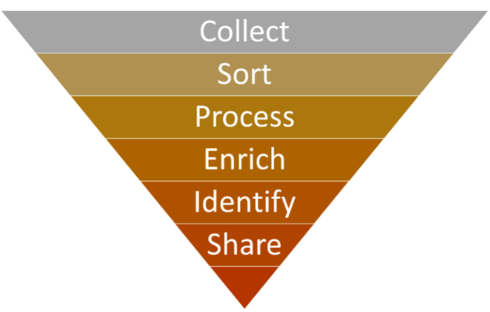
- Collect
There is a wealth of information available online that can form the foundation of a data store. Datasets containing information on logging concessions, procurement, sanctions lists, financial records, company registries, court archives and leaked documents can all contribute to an initial “big data” repository. In addition, in some countries independent bodies have already collated information on politically exposed persons (PEPs), political financing, and more. Furthermore, there are archives such as OCCRP Aleph that combine multiple sources of research material into a single, searchable repository.
Once these sources are identified, their content can be exported through the native functionality of the site or extracted through web scraping. Web scraping is the process of extracting content and data from a website – in its simplest form it is simply the act of copying online content and pasting it elsewhere. However, automating the process ensures it can be completed quickly and accurately.
Visual web scrapers such as ParseHub allow users to select the elements of a webpage to extract and input a logical sequence in which the scraper should run. They require little to no programming knowledge – the user simply needs to “visually” select the elements of the webpage that are relevant, before extracting the content into CSV format. - Sort and Process
Once collected, the data will need to be sorted and processed according to whether it is structured or unstructured. Structured data is clearly defined and sortable into separate records and fields – it can be readily understood by machine language. This includes existing relational databases or datasheets in tabular format. Unstructured data is not formatted in this way and cannot be processed or analysed using conventional data tools and methods – for example, text files, video files, and audio files are all unstructured.
We can begin to build an understanding of large volumes of unstructured data by using big data techniques to sort the information we hold. Firstly, TRAFFIC is using Nuix Investigate, a tool that quickly correlates and contextualizes thousands of data types. Running unstructured data through Nuix Investigate allows users to perform Optical Character Recognition (OCR) on text documents to convert handwritten or printed text into machine-encoded text. The tool can then identify entities within the text and categorize them into people, objects, locations, and events.
Once sorted, Natural Language Processing (NLP) tools such as Rosoka Text Analytics can take this a step further by intelligently “reading” the text and finding links between entities. Quickly analysing large swathes of text – and discovering, for example, that “Person A” is associated with “Company B” – can prove to be integral to uncovering instances of potential corruption. - Enrich and Identify
Business intelligence and visual analysis tools such as Power BI and IBM i2 Analyst’s Notebook can be used to cross-reference different sets of data, produce dashboard views of data visualizations, and create social network charts. These insights allow analysts to identify key people, companies, concessions, events, and the links between them. We see this stage as a filtering exercise. By identifying entities of interest within the initial large repository of data, we can further explore and enrich the data using tools that are better equipped for focused analysis of a smaller dataset.
Once people and companies of interest have been identified, it is beneficial to enrich the data using external data sources such as company registers. While this can be achieved through manual open source investigation, it is also possible to partially automate the process through existing tools such as Videris. These tools can help find social and professional associations, evidence of beneficial ownership, lists of company officers, and more. Once fed back into the tools above, these additional data points can uncover further insights. - Share
By sharing this information with the financial sector, TRAFFIC will be able to take advantage of the vast anti-money laundering machinery that already exists. This gives us the opportunity to cooperate with and use industry as force multipliers to target organized crime groups who direct and profit from natural resource exploitation.
Moreover, by sharing the techniques used and the lessons learned with practitioners, we can facilitate the further use of big data analytics to tackle corruption in both the timber sector and in other natural resource industries.
Considerable time has been spent on research and testing to identify which software work best. From this, it is clear that they can be critical tools for gathering, sorting and enriching huge amounts of data efficiently – far beyond what a human is able to do. However, each presented unique challenges and had different strengths and weaknesses. There were also large variations in cost. Conservation organizations wishing to use data analytics to tackle corruption need to ensure they dedicate sufficient resources to this work.
Ownership Models
This content is made possible by the generous support of the American people through the United States Agency for International Development (USAID). The contents are the responsibility of World Wildlife Fund (WWF) and do not necessarily reflect the views of USAID, the United States Government, or individual TNRC consortium members.