TNRC Blog Journey to Self-Reliance 2020: Starting a Conversation about Data, Corruption, and Environmental Policy

Journey to Self-Reliance 2020: Starting a Conversation about Data, Corruption, and Environmental Policy
At the start of October 2020, USAID released the latest update of the country road maps for the “Journey to Self-Reliance" (J2SR). USAID describes the J2SR as measuring a country’s “capacity to plan, finance, and implement solutions to local development challenges, as well as the commitment to see these through effectively, inclusively, and with accountability.” For those not familiar with the J2SR, a good introductory blog can be found here.
The J2SR includes a number of useful key metrics. We wanted to analyze that data to see if it could help us – and other practitioners – better understand the effectiveness of states’ environmental policy and how corruption may affect it. We also hope that this analysis can contribute to the J2SR’s learning agenda.
In the TNRC project, we are already conducting research and supporting projects in 17 countries, and the J2SR data provides us with an additional way to think about the governance contexts for these efforts. The same learning and discussion is of course also useful for the wider community working on conservation or natural resource management. Throughout this blog, we signpost topics with a Twitter icon ( ) where we’d love to get public feedback on to help inform our learning agenda. Tweet at us on these or anything that comes to mind as you read through!
Before getting into the analysis, we want to add two disclaimers.
- We are aware that there could be lots of debate over the appropriateness of the indicators that the J2SR has chosen, and problems of using corruption perception data. The purpose of this blog is not to enter into those debates, but we recognize that it is an issue and could be an area for future research and discussion.
- This analysis is not intended to be a rigorous statistical exercise. Instead, our goal is to identify some preliminary trends about the relationship between indicators of corruption and the effectiveness of environmental policy.
How does the J2SR incorporate environmental policy and corruption?
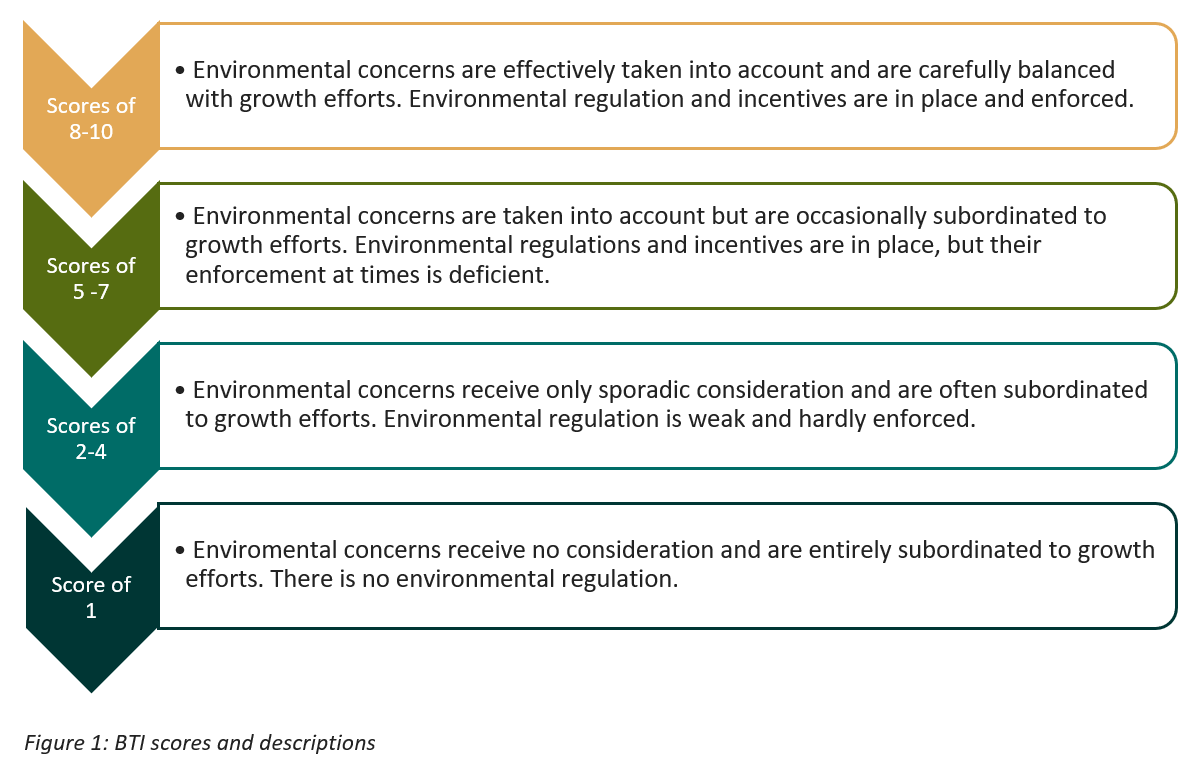
The J2SR has an Environmental Policy indicator (EPI) that draws from the Bertelsmann Transformation Index (BTI) and “measures the soundness of environmental stewardship and natural resource management, factoring a wide array of macroeconomic policies with environmental consequences, such as energy and tax policies, and incentives at the firm and household levels. The metric also factors whether legislation and regulations are effectively executed, as well as the influence of societal stakeholders beyond the government, including the private sector and civil society.” Scores range from 1-10, but as can be seen in Figure 1, it is only once a country reaches a score of 8 that environmental policies can be considered effective and laws appropriately enforced.
Although corruption does not have its own primary indicator, two indicators in the J2SR include an aspect of measuring corruption:
- Open Government (OpenGov): This is drawn from the World Justice Project (WJP) Rule of Law Index. It includes a measurement on “Absence of Corruption,” which looks at the perception levels of bribery among members of the executive, legislative, judicial, and military/security branches.
- Tax system effectiveness (TaxEff): Corruption is considered as part of the calculation for one of the TaxEff components – “Tax capacity.” The data is drawn from the World Bank’s Worldwide Governance Indicators (WGI).
A third indicator, Government Effectiveness (GovEff), does not contain a direct measure of corruption. However, we assumed a) it should be closely correlated with better EPI scores, because a more effective government could better deliver environmental policy, and b) that such higher efficiency and policy scores would indicate less corruption. So, we thought it would be a useful additional indicator to review.
We also decided to compare two more specific indicators from outside the J2SR to help us better understand the effects of corruption, and to try to take a more inclusive perspective on governance:
- Transparency International’s Corruption Perception Index (CPI), and
- Gender, using USAID’s Women’s Economic Empowerment and Equality (WE3) Dashboard. The literature on gender and corruption is mixed on whether involving women actually leads to fewer incidences of corruption, so we wondered if the J2SR data could illuminate the topic.
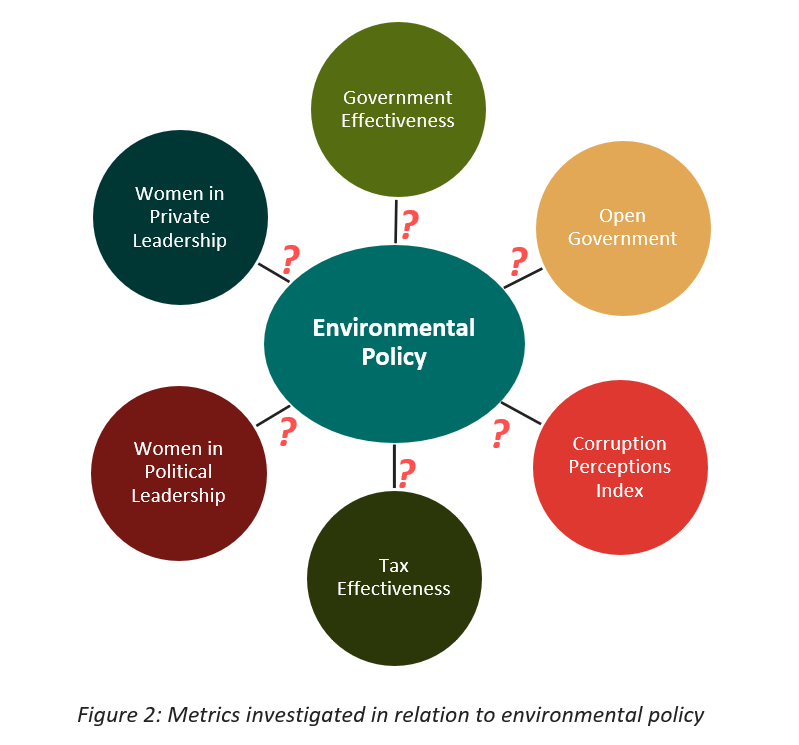
Taken together, we wanted to see if the data could show us any relationships between environmental policy and these theoretically linked metrics, across a range of countries. See Figure 2 for an illustration.
So, what’s in the data?
The EPI
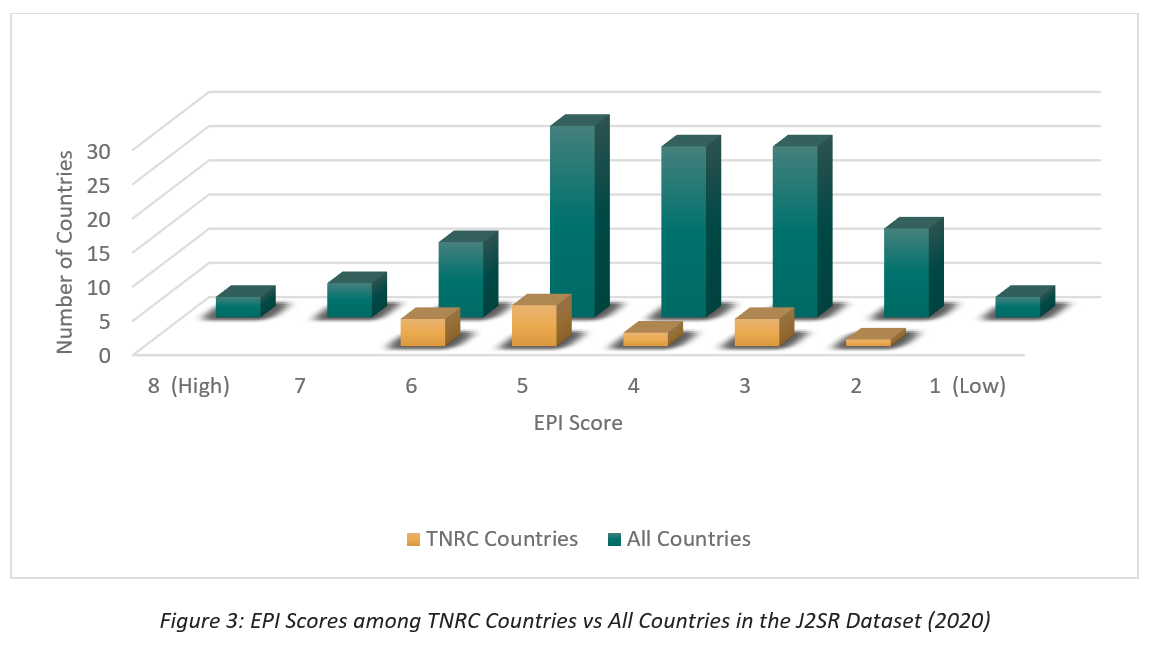
As of 2019, 79% of the countries the J2SR covers have an overall EPI score between 2 (little attention to environmental issues at all) and 6 (existing regulations are not enforced). ( ) So, for J2SR countries, practitioners should assume that – at best – existing regulations are not enforced - even if the policy exists on paper. ( ) Scores for the countries where TNRC works fall into that same 2-6 range. In recent years, some TNRC countries (Peru, Serbia) did manage to improve their scores up to 7, but then fell back. TNRC is therefore working across a range of country experiences in environmental governance, roughly paralleling the experience of the majority of the countries in the J2SR data. This gives us confidence our findings will have applicability across a range of contexts.
Changes in the EPI Over Time
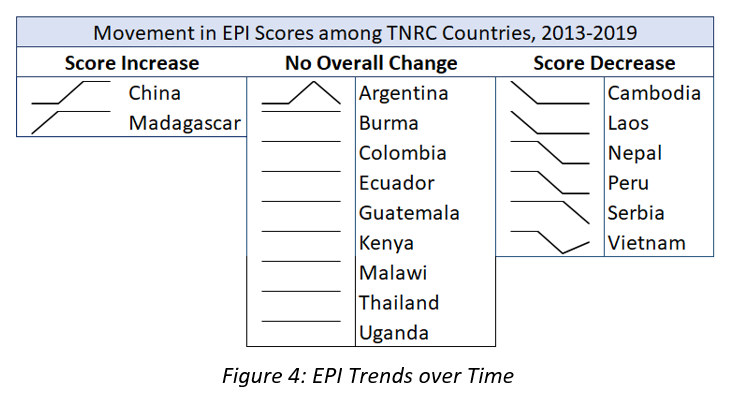
In all the countries in which TNRC is working, only two countries (China and Madagascar) have managed to improve their EPI score since 2013. All the others have either remained static or regressed, as Figure 4 shows.1 This data seems to echo other reports showing how poorly many countries are faring in meeting the global 2010 biodiversity targets, ( ) and is a worrying trend.
Relationships between EPI and the Other Indicators
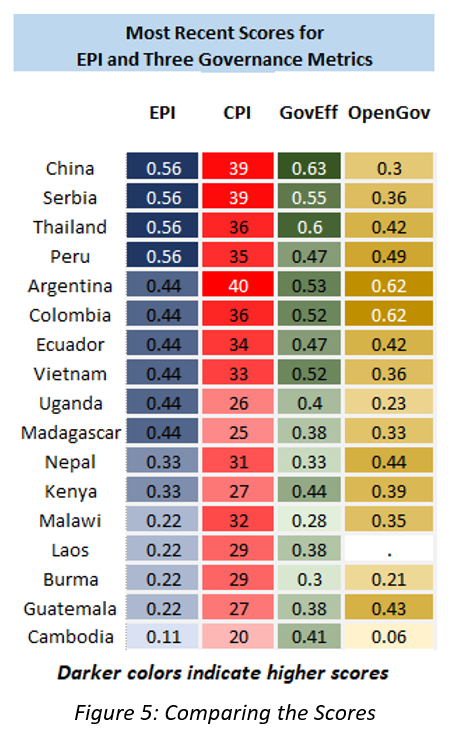
We compared the most recent J2SR scores for EPI, GovEff, and OpenGov among TNRC countries, shown in Figure 5. GovEff and EPI do seem related, which confirmed our assumption. OpenGov and EPI seem less related but, as explained below, we’re not ready to completely set OpenGov aside.
Changes in Governance and Other Scores Over Time
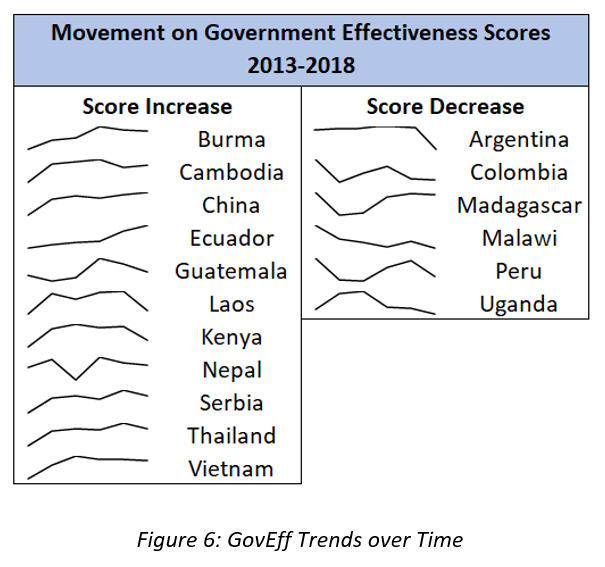
Half of all countries in the J2SR saw an improvement in their GovEff score from 2013 to 2018. The other half saw a decrease, and the “journey” has been different for each. As Figure 6 shows, some rose then fell, or the other way around. Twelve of the 17 TNRC countries saw an improvement in their GovEff score, even if the change was very small (i.e., Laos and Guatemala).
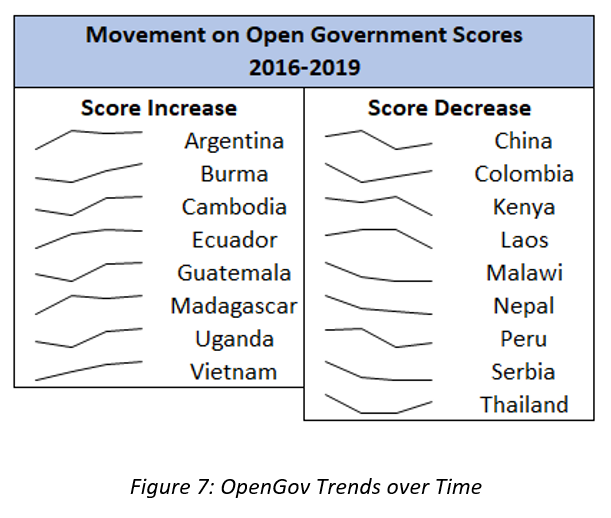
More J2SR countries have lost ground on the OpenGov metric than have gained (35% and 21%, respectively) and this is true for TNRC countries as well. See Figure 7. This may explain why we saw less correlation between the OpenGov indicator and the EPI. However, we noted critical differences in the amount of data available for these metrics. While the GovEff data is nearly complete, nearly half of all countries have little or no data for the Open Government metric.
We then added Transparency International’s CPI as our third metric, and the one most directly related to TNRC’s questions about natural resource management and governance. When we did that, we saw a strong parallel with each country’s EPI score When we looked at those scores in conjunction with the GovEff data, the results retained most of the relationship we saw between EPI and GovEff. This preliminarily supports the idea that good governance is key to strong environmental policy. The exceptions were three countries whose EPI scores are lower (Argentina) or higher (Uganda and Madagascar) than we would expect if EPI and CPI were tightly connected. TNRC will explore that more in depth as we work with pilots and research teams in those countries.
Our analysis of the other two topics, tax effectiveness and gender, were inconclusive due to insufficient data. Because TNRC has another three years of learning and research ahead of us, though, we will continue to hope for more data in successive J2SR reports for long-term learning purposes.
And, so, preliminarily speaking…
The J2SR dataset is well organized and the metadata is thorough, which makes this a fun dataset to play with. But what, if any, observations can we draw?
In the most recent data, there appears to be a very strong relationship between EPI scores and CPI scores. This suggests that those working directly on conservation or natural resource management projects need to take a deeper look at how corruption undermines environmental policy and implementation. From the J2SR data it appears to be a key binding constraint to delivering improvements. ( )
The GovEFF indicator also shows us, that certain types of reforms and improvements – even in quite corrupt environments – are possible. Learning among organizations that might work on the issues that make up the GovEFF indicator would be valuable to explore how different reform pathways were pursued. Even if the answer is “political will,” we still ask “well how was that will generated?” ( ) These are important lessons for those working in conservation or natural resource management who seek to change public policy.
Clearly, more effort needs to be made to gather relevant and actionable data related to gender and the role of women in private and political leadership. More investment in data in this area would be very welcome.
An interesting issue to explore further is the lack of a stronger relationship between Open Government and the EPI. ( ) The Open Government indicator includes sub-indicators that go beyond transparency to include the additional elements of civic participation and accountability. Since we know that those additional elements are very important for transparency to help prevent corruption, and that corruption can have a devastating effect on environmental policy, the disconnect is concerning. It may suggest that the civic participation and accountability measures in the indicator are too ‘soft’, counting mechanisms that in reality lack the necessary teeth to ensure consequences. We know, however, that this is one small data point in a rich debate and research agenda; an agenda to which TNRC hopes to contribute.
It is also concerning that so many countries in the J2SR data have gone backwards on this indicator. This could represent an opportunity for environmental organizations to collaborate with good governance organizations. Such collaboration will likely identify synergies relevant to both areas of work. Similarly, if not doing so already, USAID should ensure that cross sectoral learning discussions occur with staff at mission.
In terms of TNRC’s focus countries, we are pleased to see the portfolio we assembled reflects the larger set of J2SR countries in many ways, if not all. While we know anti-corruption work is difficult to generalize across different contexts, it’s still great to have parallels to the larger set that can help us think about what limits generalizability. The granularity of the research that TNRC is undertaking will provide additional detail.
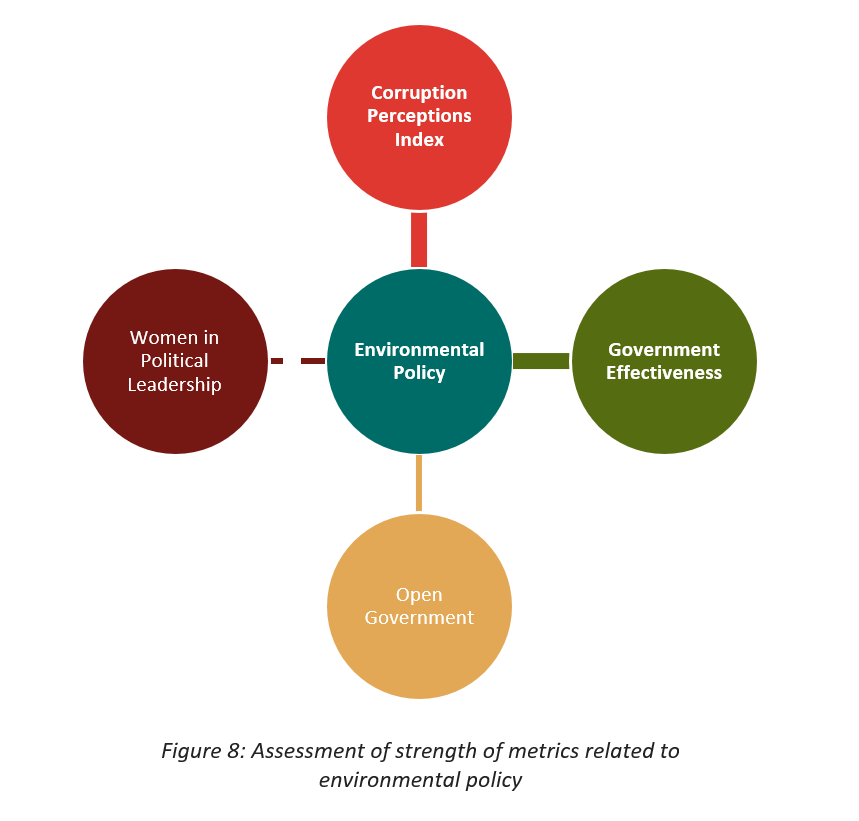
Figure 8 summarizes the strength of the relationships between the different indicators.
Ok, what next?
While our discussion touched on some of the gaps, we still look forward to seeing how this dataset expands over the years for TNRC’s learning purposes. What the data can tell us right now is that reforms in environmental policy have been largely static or gone backward over the last decade, which suggest that many of our projects or interventions will be working in difficult reform environments. ( ) If we are to meet the dual crises of the climate and biodiversity over the next decade, the ability of countries to design, implement, and deliver effective environmental policy is more critical than ever.
We want to learn from you as well! Please find TNRC on twitter to probe this discussion further, pose your own questions, adjust our thinking, or tell us what you’re working on related to this! It may be that corruption is a fundamental binding constraint stopping improvements in environmental policy and if so, more resources will need to be directed at this problem if the world is to meet the climate and biodiversity challenge. TNRC is actively investigating these linkages and the more we can work with, learn from, and strategize with partners, the better.
1 The set of sparklines show that not a great deal of movement has happened within the TNRC Countries, though we note each country only has four years of data. This is because the BTI is only released biannually (whereas other metrics in the J2SR are annual). It creates some challenges for our analyses, but we can still work with it. Go back to the text.
Image attribution: © naturepl.com / Jen Guyton / WWF; © Brian J. Skerry / National Geographic Stock / WWF; © Georgina Goodwin / Shoot The Earth / WWF-UK; © Hkun Lat / WWF-Aus