Indonesia
Mapping the plastic waste landscape, regulatory, and investment environment to identify scalable opportunities for addressing plastic waste and building towards No Plastic in Nature

© The Circulate Initiative
About the assessment
Research in the assessment breaks down across four key dimensions: Socioeconomic, Plastic Flows, Regulatory, and Funding.
- Indonesia is recognized as the second most biodiverse country, but approximately 13% or around 5 million hectares of Indonesia’s land-based biodiversity hotspots are threatened by plastic pollution.
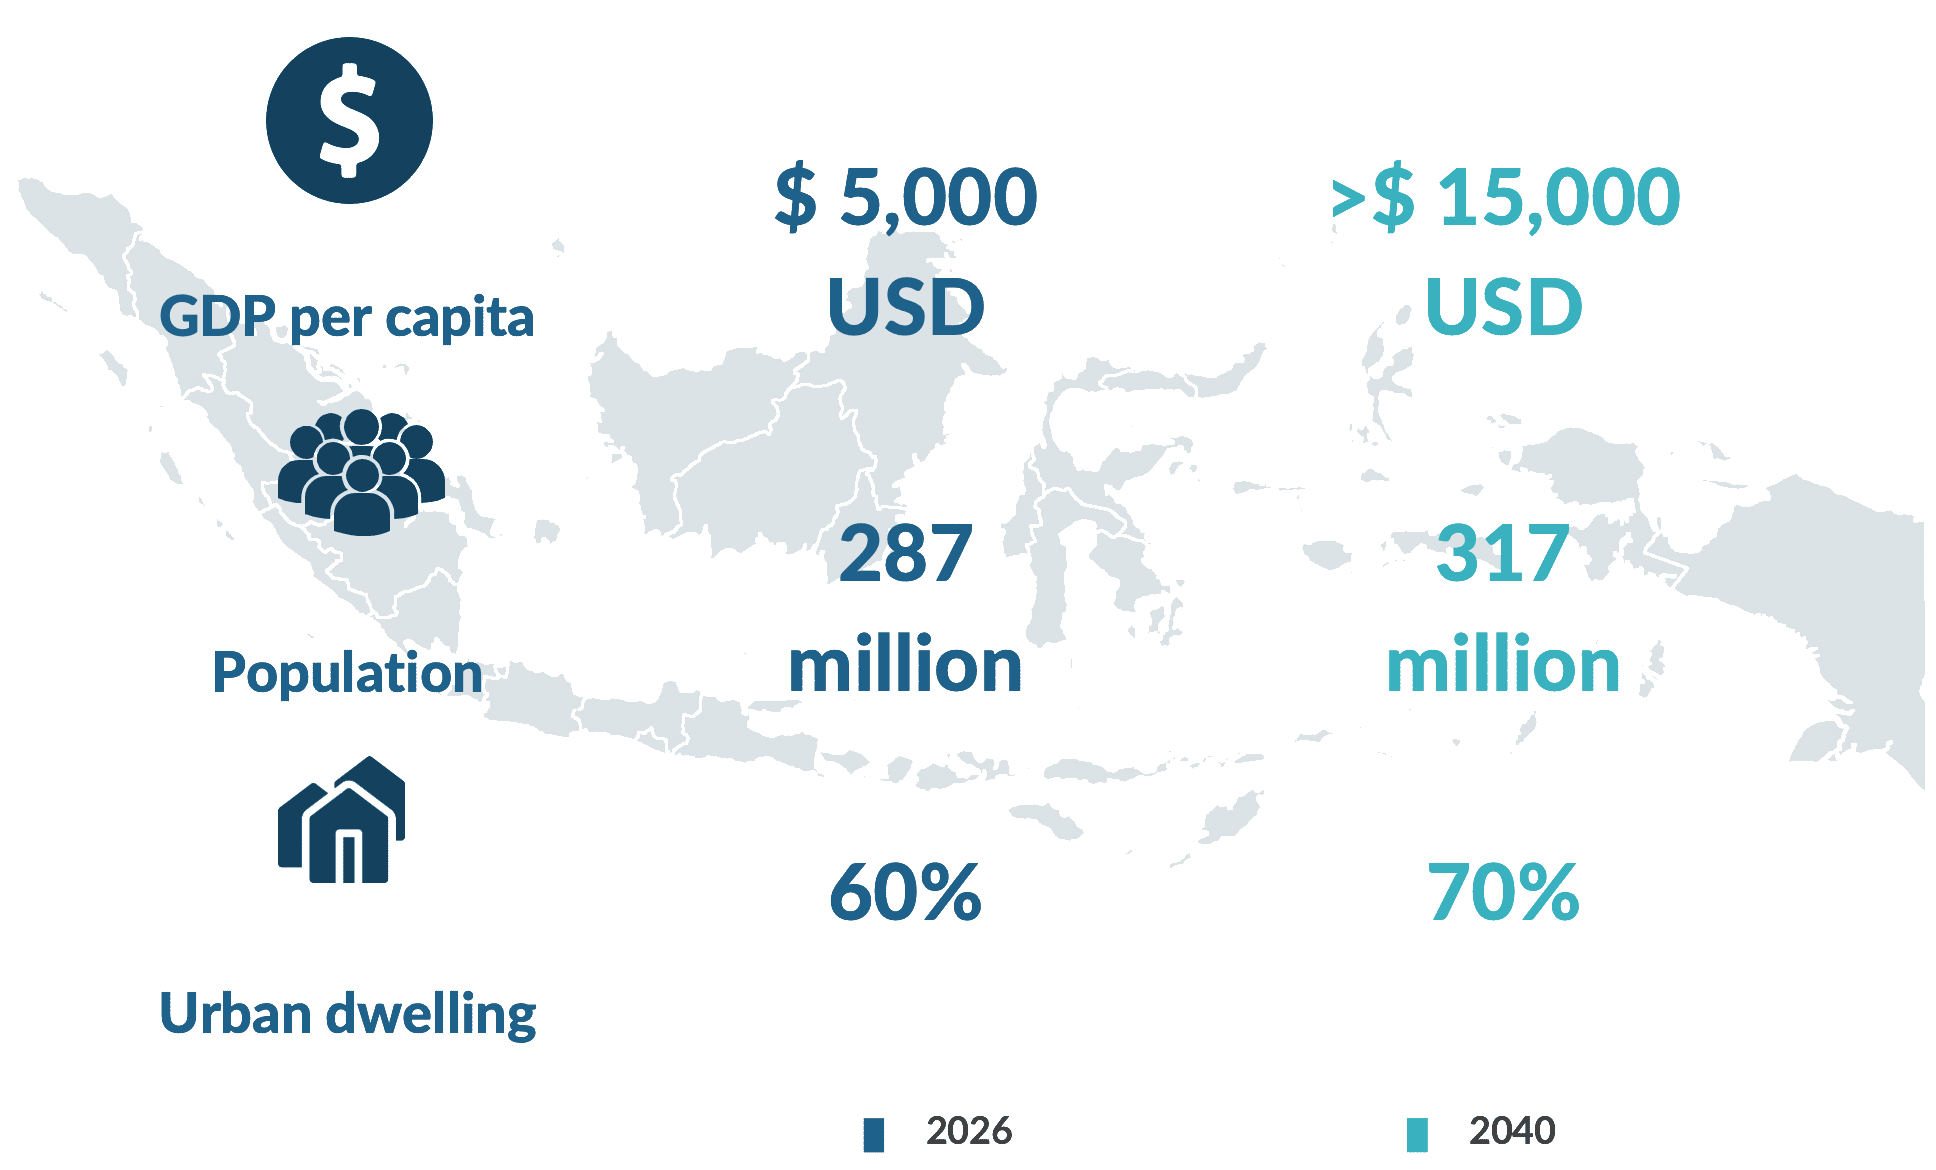
- With a population of 287 million representing more than 600 ethnic groups, Indonesia is the most populous country in Southeast Asia and the fourth most populous in the world.
- It is composed of over 17,500 islands, meaning significant coastlines that increase the risks of plastic pollution entering the ocean.
- Indonesia is SE Asia’s largest economy and the country’s annual GDP growth has remained stable at around 5% over the past five years.
- Indonesia is a net importer of oil and plastics, with the food and beverage industry being the largest consumer of plastics, accounting for 60% (4.5 MT) of total consumption.
- Advancing circular systems in Indonesia is critical for meeting global conservation goals, and the country has significant national ambitions to tackle plastic pollution.
Summary
Key Headwinds
- As Southeast Asia’s largest economy, Indonesia has a predictable baseline supply of plastic feedstock needed to secure long-term investment in fixed recycling infrastructure.
- The ban on plastic waste imports and soon-to-be announced mandatory extended producer responsibility (EPR) are increasing pressure to fund domestic collection infrastructure.
- Emerging end markets, such as automotive, could create reliable, high-value demand for lower-value polyolefins.
- Co-locating sorting hubs at local waste sites in outer-island regions helps pool regional supply, and could reduce inter-island shipping costs.
Key Tailwinds
- Lack of formal collection infrastructure leads to high contamination, and dependence on two million informal waste pickers creates environmental, social, and governance (ESG) investment risks.
- The government’s commitment to invest in waste-to-energy (WtE) could result in less plastic waste being available for recycling.
- Demand for PET is saturated, as local manufacturers favor lower-cost virgin resin over recycled content.
- Institutional funds seek large deployments (US$ 10 million+), but recyclers and aggregators require much smaller capital injections (less than US$ 5 million).
Socioeconomic
Sustainable Development
- GDP per capita is $5,000 USD, with 60% of Indonesians residing in urban areas.
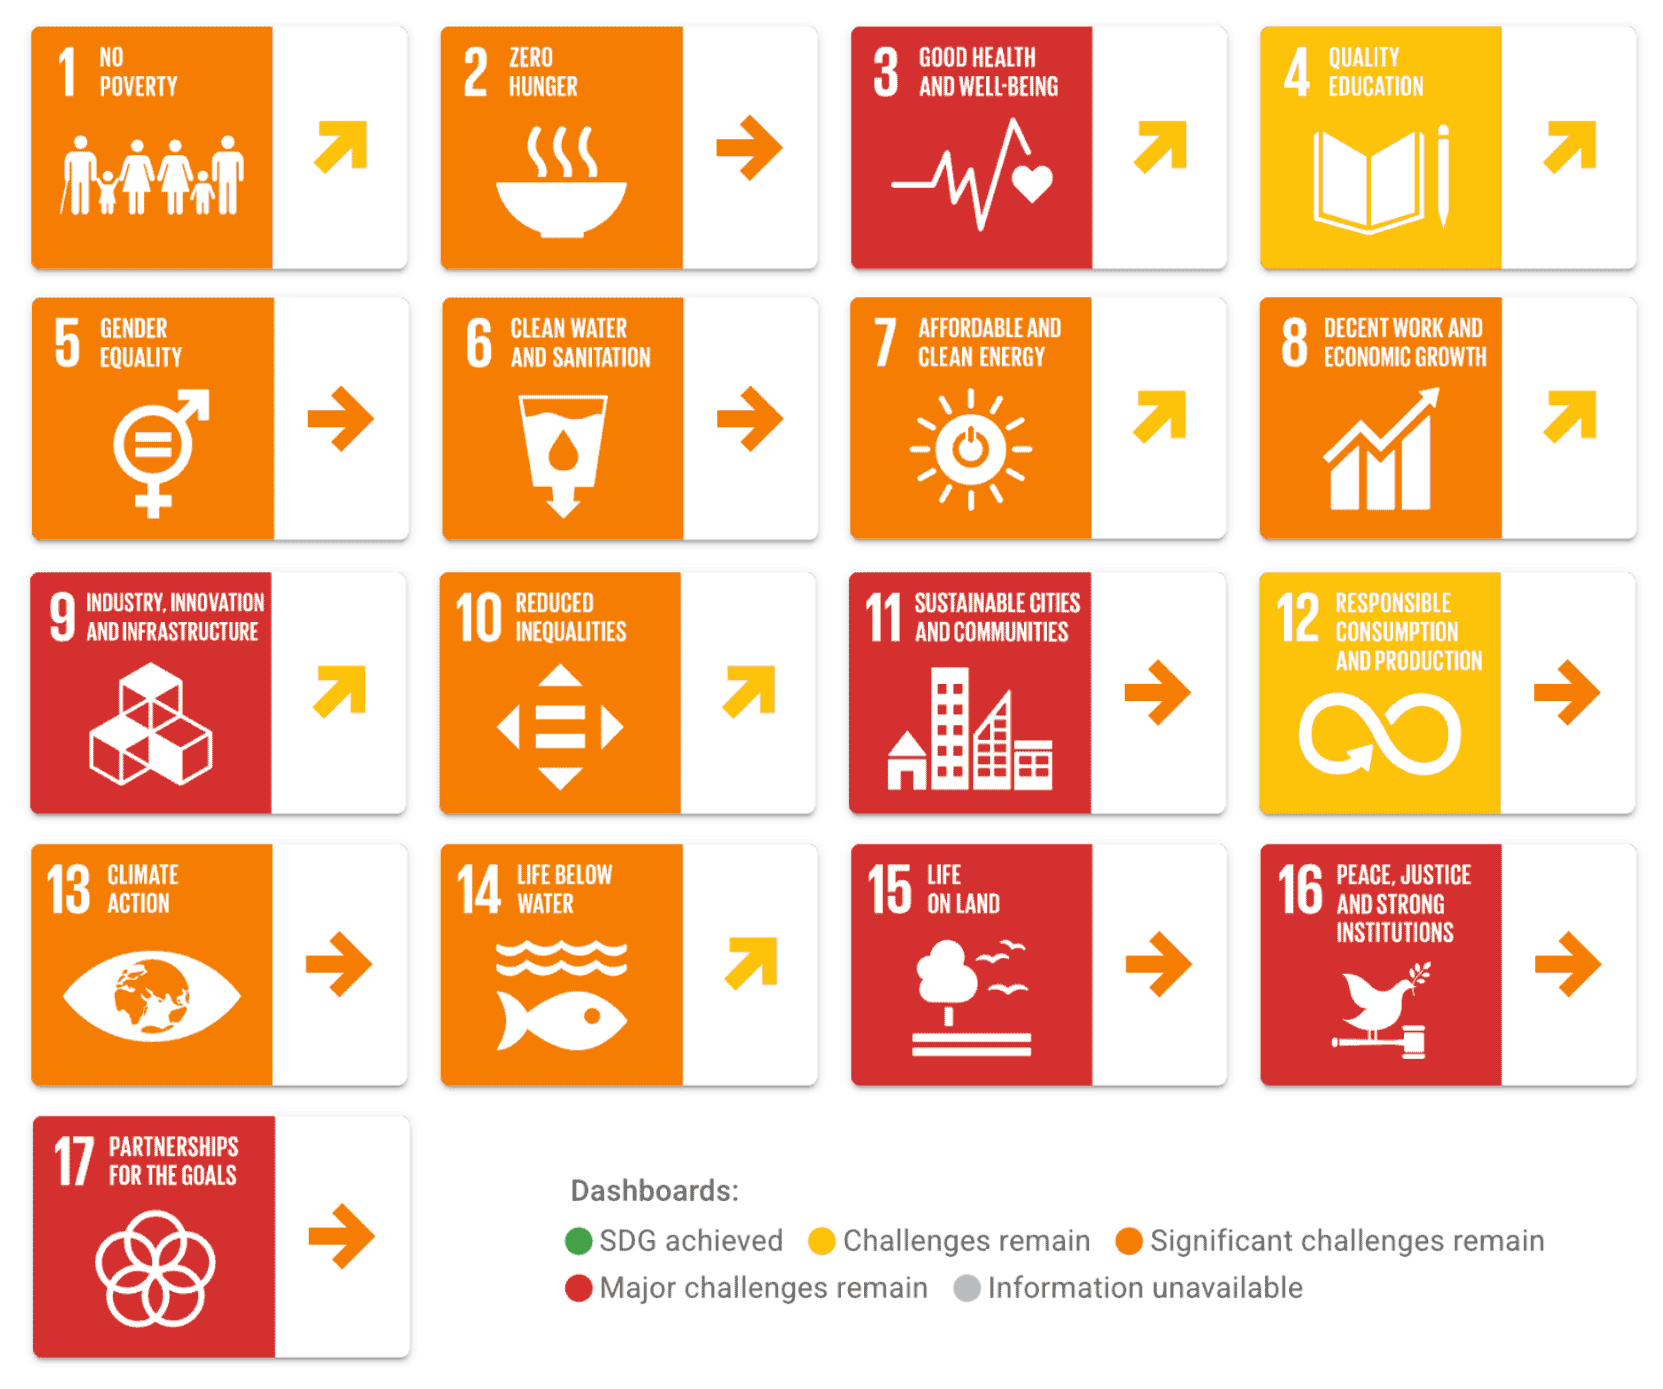
- Indonesia ranks 74th out of 169 countries on the Sustainable Development Goals Index, showing moderate overall progress across most goals.
- Indonesia’s major challenges are in areas such as Good Health and Well-being (SDG 3), Industry, Innovation and Infrastructure (SDG 9), Sustainable Cities and Communities (SDG 11), and Peace, Justice and Strong Institutions (SDG 16).
Progress Toward Sustainable Development Goals
© Cottom et al. ; Sustainable Waste Indonesia
Plastic flows
Plastic Production
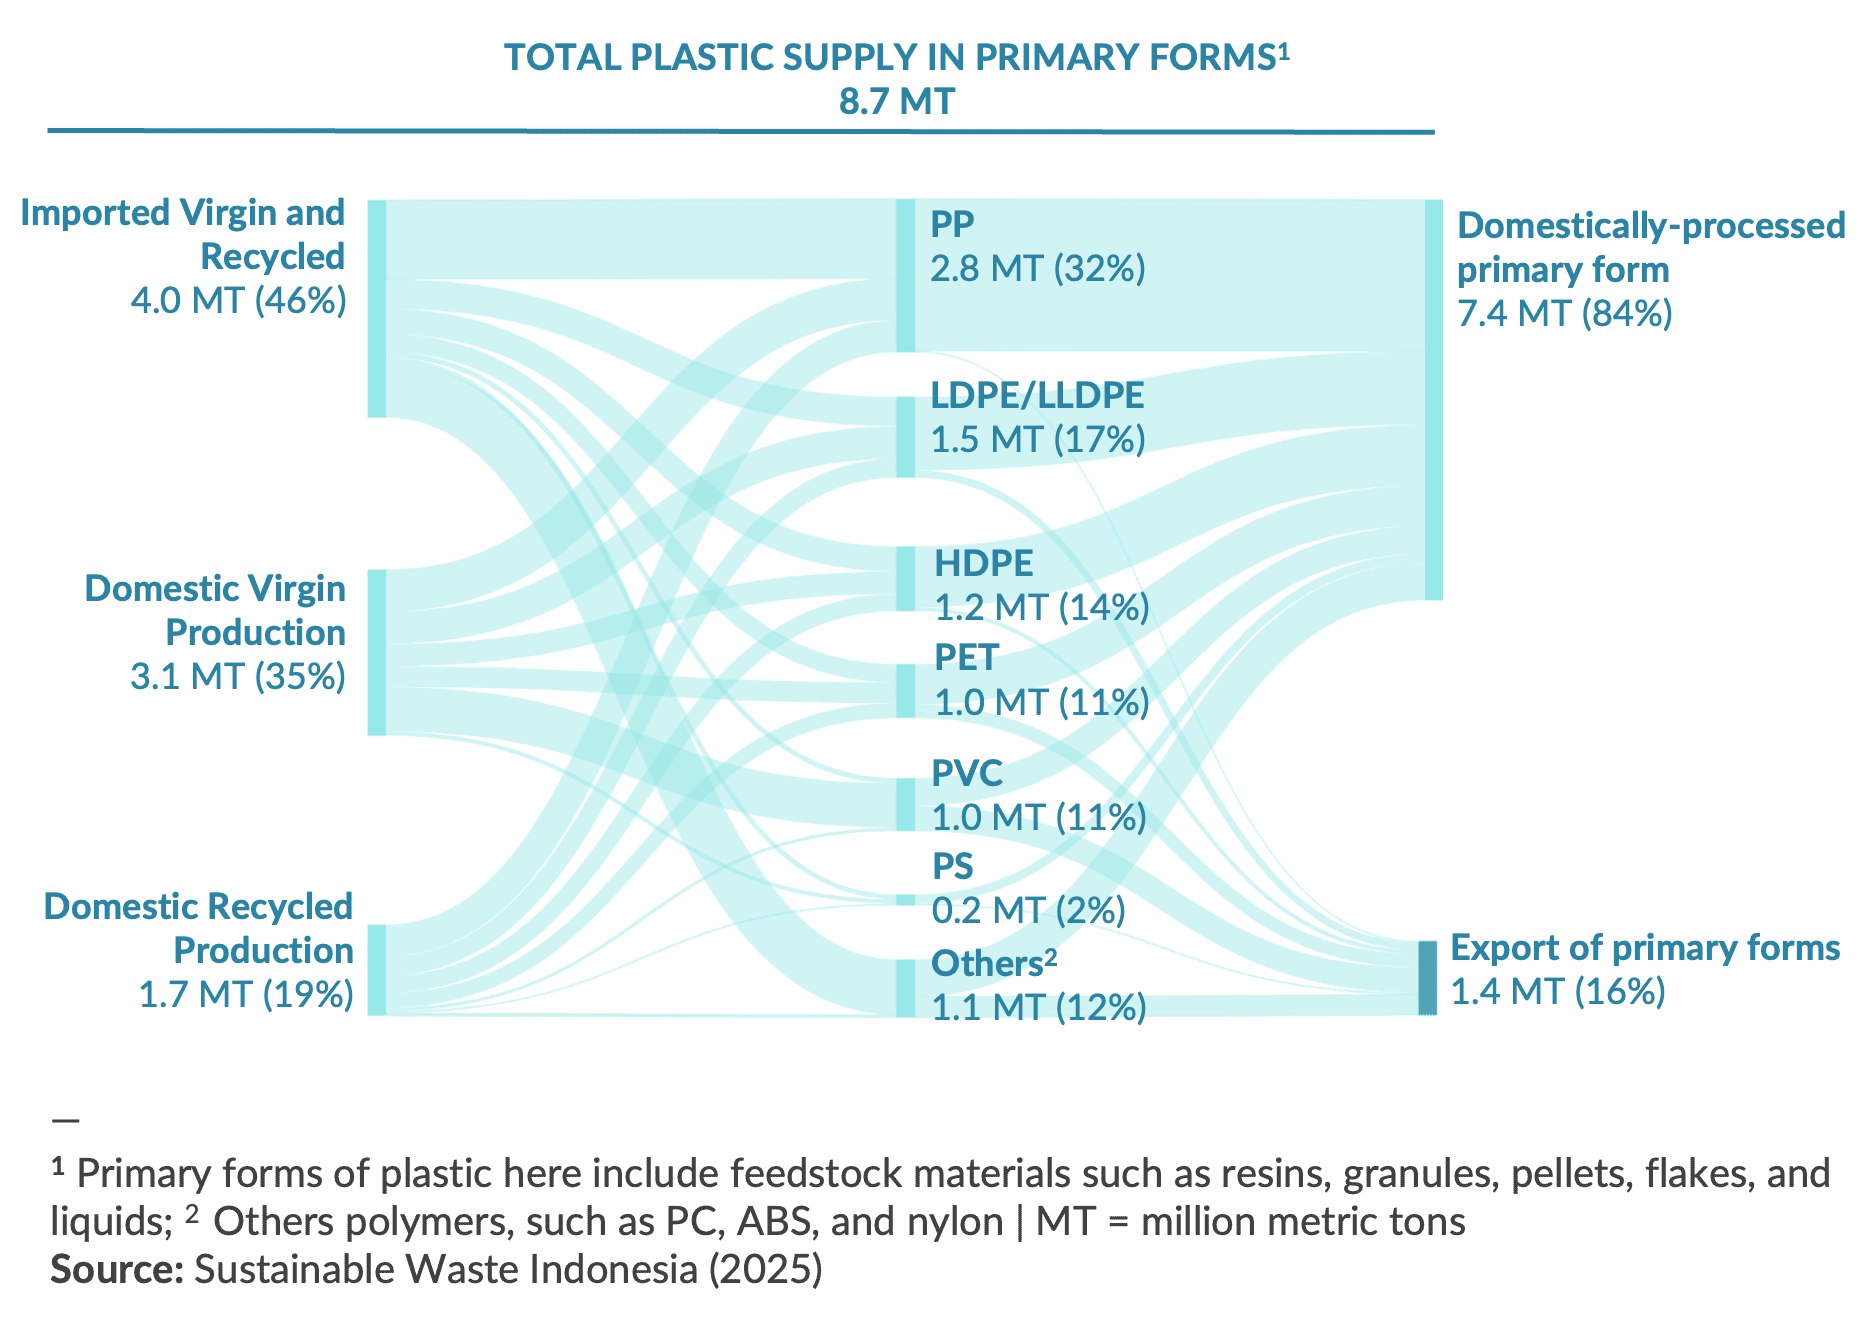
- 8.7 million metric tonnes of plastic feedstock enter Indonesia annually.
- 54% is produced domestically, with 19% of domestic supply coming from recycled feedstock.
- Domestic capacity remains insufficient to meet demand, driving continued reliance on imported virgin plastics.
Plastic Waste Generation and Management
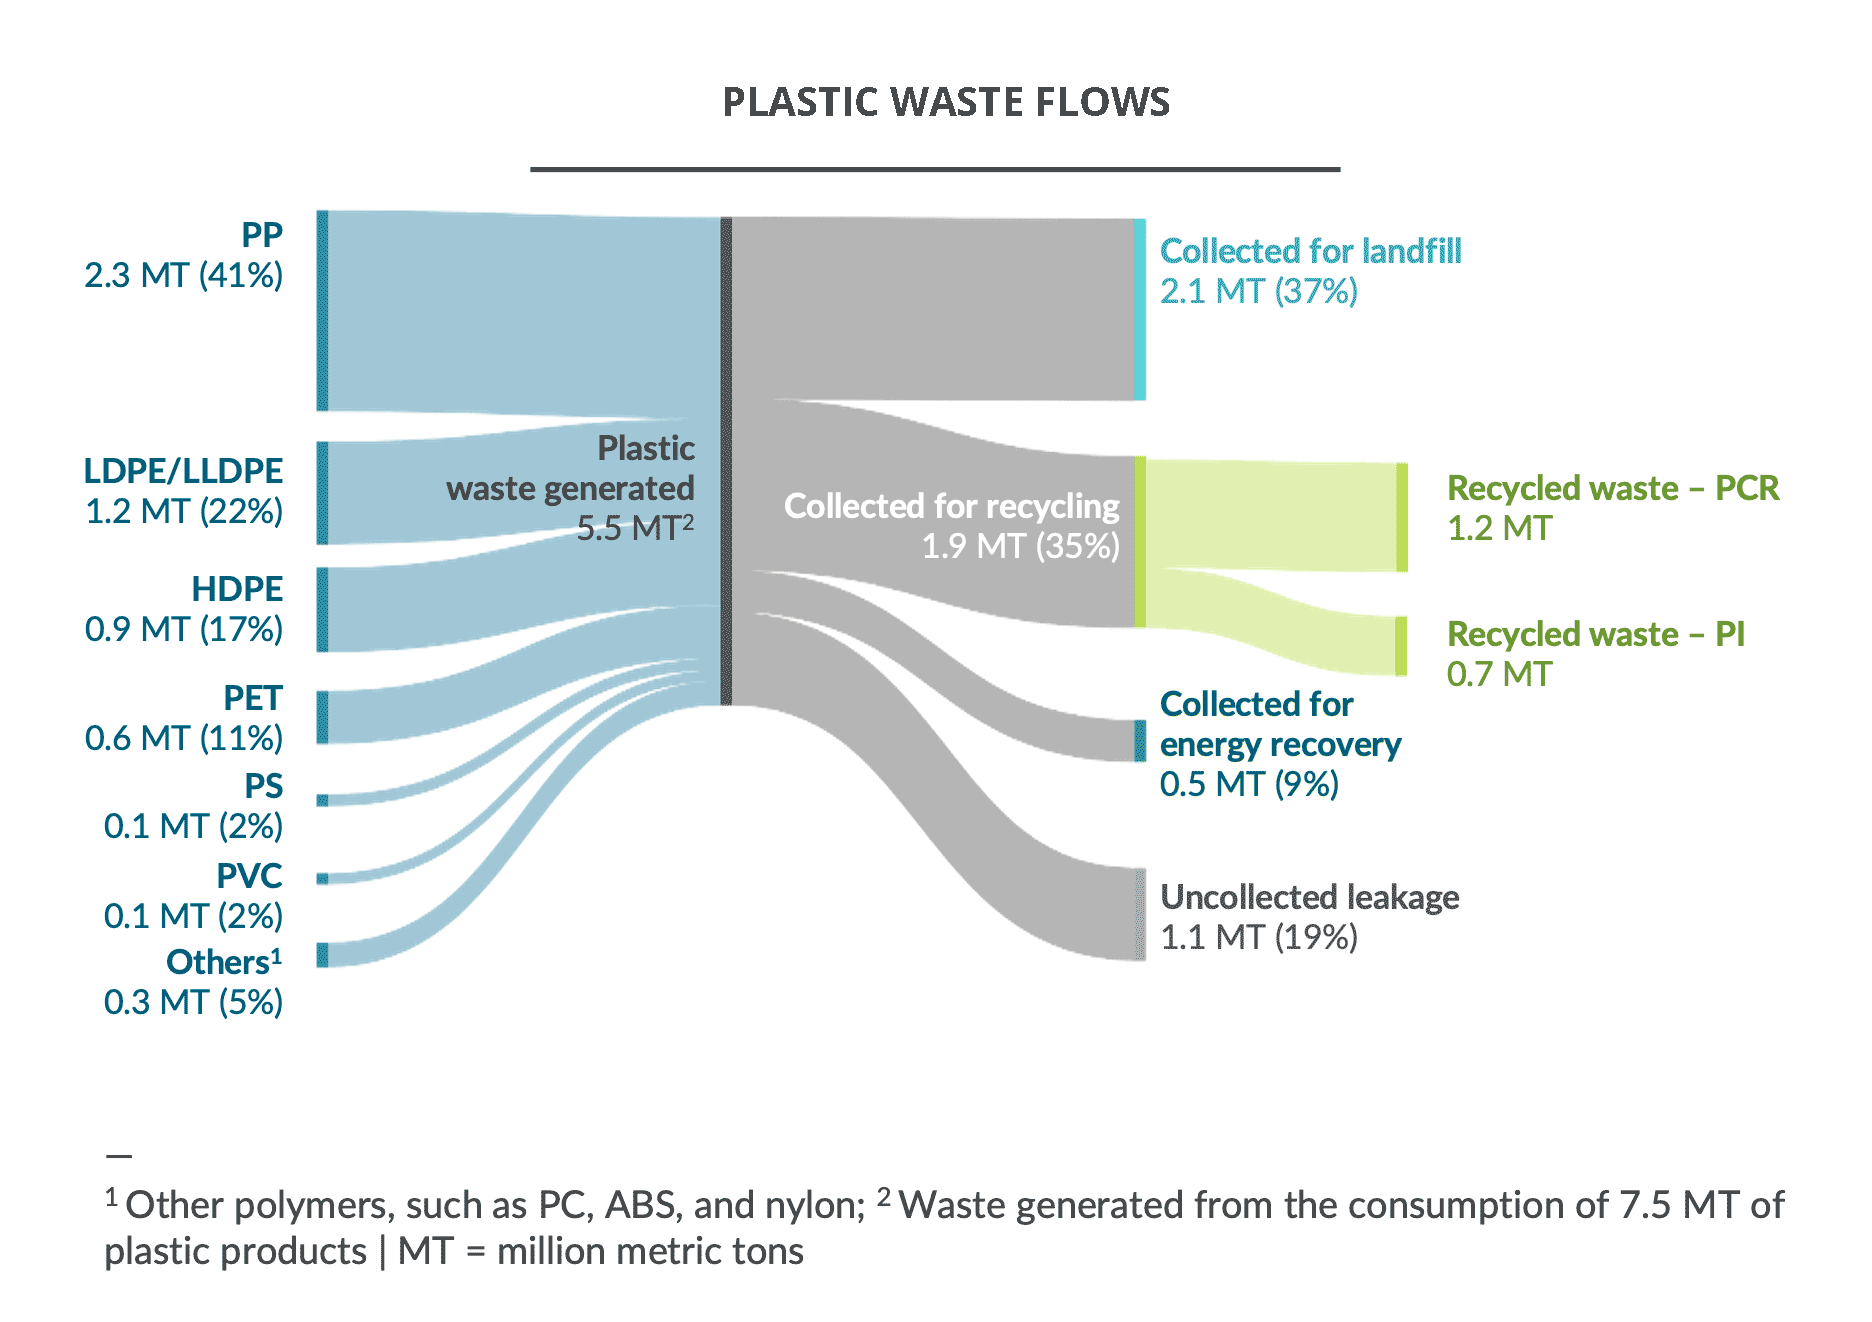
- Indonesia produces 5.5 million metric tons of plastic waste annually, making plastic pollution a critical challenge.
- 19% of plastic waste leaks into the environment, 37% goes to landfill, 9% to energy recovery, and 35% is collected for recycling.
- An estimated two million informal waste workers, or pemulung, account for approximately 90% of plastic waste collection.
- Indonesia has an estimated 3 million metric tons of installed recycling capacity, with utilization at just 55%.
Regulatory
Policies Governing Plastic Waste
- Key policies include the national ban on plastic waste imports, regional bans on single-use plastics, and the upcoming EPR and recycled content mandates.
- The import ban is reshaping the recycling industry and increasing reliance on domestic supply chains.
- Policy discussions are expanding beyond waste collection to recycled content, ecolabeling, and packaging design.
Implemented Policies and Regulations
- Ban on single-use plastics
Some regional and local regulations ban single-use plastics in retail markets, but not in traditional markets. There is currently no national regulation in place. Indonesia aims to end single-use plastic use nationally by 2029. - National waste segregation
Mandates every waste generator to conduct waste segregation; however, there is no enforcement on the ground. Jakarta began enforcing mandatory household waste segregation on May 10, 2026, amid landfill overcapacity. - Waste management coverage
Targets 100% waste management coverage by 2029, including full collection and treatment coverage. - Recycled content rate directive
A directive under the 2020-2029 waste reduction roadmap requiring producers to use 50% recycled content in plastic packaging across polymer types. - Plastic waste trade restrictions
Indonesia has long had restrictions on plastic waste imports. More recently, it introduced stricter controls on plastic waste imports, effective January 1, 2025. - Ratification of the Basel Convention
Indonesia is a party to the Basel Convention. - WtE as an end-of-life solution
Sets out the framework and requirements for developing and operating urban WtE projects.
Source: Various regulatory sources
Investing in Circularity
Overview of Funding of Waste Management and Plastics Circularity
- The Indonesian government estimated ~US$14 billion is needed to fund waste management between 2025 and 2029.
- An estimated US$ 5.8 billion was invested from 2018 to 2025, led by government funding (70%), Development Finance (22%), Official Development Assistance (6%), and private-sector funding (2%).
- Most investment opportunities require less than USD$ 5 million, creating a mismatch with investors seeking larger deals.
- Indonesia’s sovereign wealth fund prioritizes Waste-to-Energy, widening the funding gap and inhibiting the growth of recycling by diverting plastic feedstock to lower value use.
Plastics Circularity Funding Sources
Government Budget1:US$ 4.1B (2018-2025)
Operational expenditure and infrastructure establishment
Development Finance2: US$ 1.3B (2018-2025)
Mostly goes to waste management improvement projects and marine debris reduction
Official Development Assistance (ODA)3: US$ 338M (2018-2024)
Mostly goes to waste management and capacity-building projects
Private Sector4: US$ 90M (2018-2025)
Mostly goes to downstream solutions (recycling and recovery), with few deals in alternative materials and refill/reuse
—
[1] Includes solid waste management (SWM) budget from national, provincial, and regional governments; some figures are estimated based on assumptions and calculations; [2] Figures include only projects focused exclusively on SWM in Indonesia and represent funding commitments rather than actual disbursements; [3] ODA values are based on disbursements; [4] Value is derived only from disclosed deals.
Source: The Circulate Initiative analysis; OECD; Ministry of Environment; Ministry of Finance; Ministry of National Development Planning/National Development Planning Agency; and other public sources.